| Raw data | results_vsoc_01 |
| Version | vsoc 0.01 |
| Class | vsoc.camps.goalgetter.GGCamp |
| Project homepage | http://vsoc.sourceforge.net |
For these tests feed forward ANNs where used. They where all initialized with random weights at the beginning of each run. One population consists of 21 individuals. From these individuals 6 are choosen to participate at a match. 3 in the right and tree in the left team. They play a match of 'stepsPerMatch' steps. After the match the following parameters are collected for each player to generate a fitness valule.
| kickCount | The numper of ball kicks |
| otherGoalsCount | The number of goals a player scored |
| ownGoalsCount | The number of own goals a player scored |
The fitness is then calculated by the folowing formula
f = kickCount + 100 * otherGoalsCount - 100 * ownGoalsCount
After 'selectionInterval' matches from the fittest individuals a new generation is generated by the following rules.
Then a new simulation cycle is started with this new population.
Goal of this testrun was to determine the optimal value for mutation rate ('mutationRate'), steps per match ('stepsPerMatch') and selection interval ('selectionInterval'). For stepsPerMatch and selectionInterval the optimal value is the minimum that does not influence the result any longer.
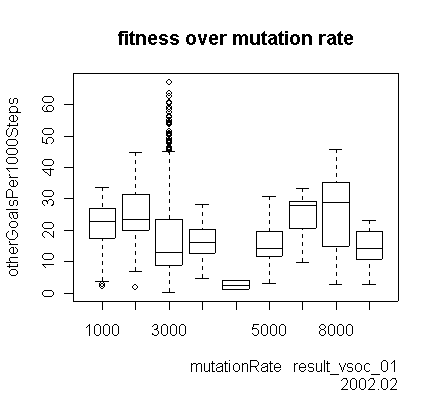
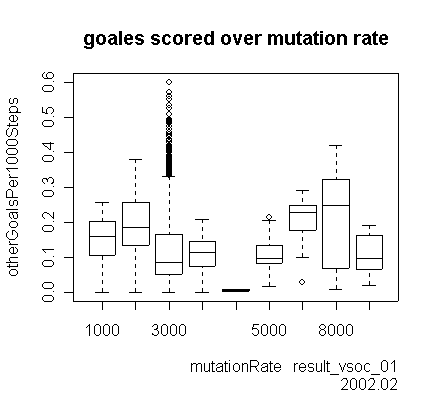
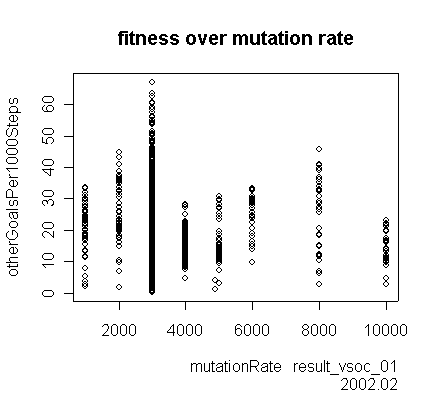
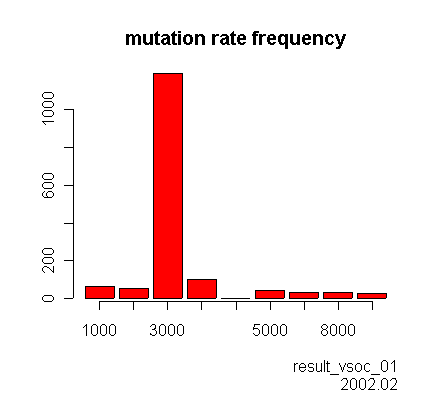
The results_vsoc_01 data set contains 48 simulation runs in which contain diffrent values of mutationRate. Each of these runs contain multiple observaions of fitness. The frequency of observations for diffent values of mutationRate can be seen in the following diagram.
The fitness and goals scored for these values can be seen in the following two diagrams.
These diagrams show that no optimal value for mutation can be determined from the results_vsoc_01 data set. New simulations have to be run with other ranges of mutationRate. I suggest a wider range. E.g. 1000, 10000, 30000, 40000.
The frequency of observations for diffent values of stepsPerMatch can be seen in the following diagram.

The fitness and goals for these values can be seen in the following two diagrams.
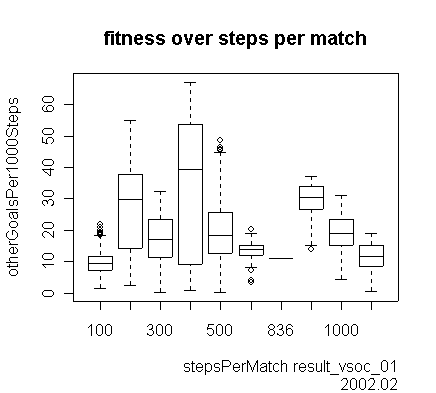


There seems no significant dependence of the fitness from the duration of a match. Except simulations with stepsPerMatch = 100 seem to have lower fitness values. Suggestion for further simulation runs: 50, 100, 150, 200, 300, 1000. Usage of these values should show what could be the shortest duration of a match in order to get results.
The frequency of observations for diffent values of selectionInterval can be seen in the following diagram.

The fitness for these values can be seen in the following two diagrams.

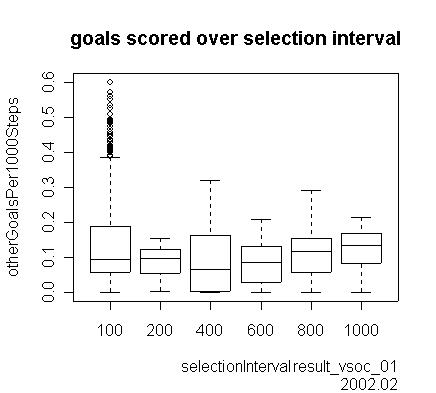

Longer selection intervals than 100 (matches) seem not to result in better fitness. The range between 10 and 100 should be tested in further runs. Values smaller than ten would result in individuals that are not tested at all in one simulation run. Suggestion for further runs: 10, 30, 50, 75, 100, 200, 1000